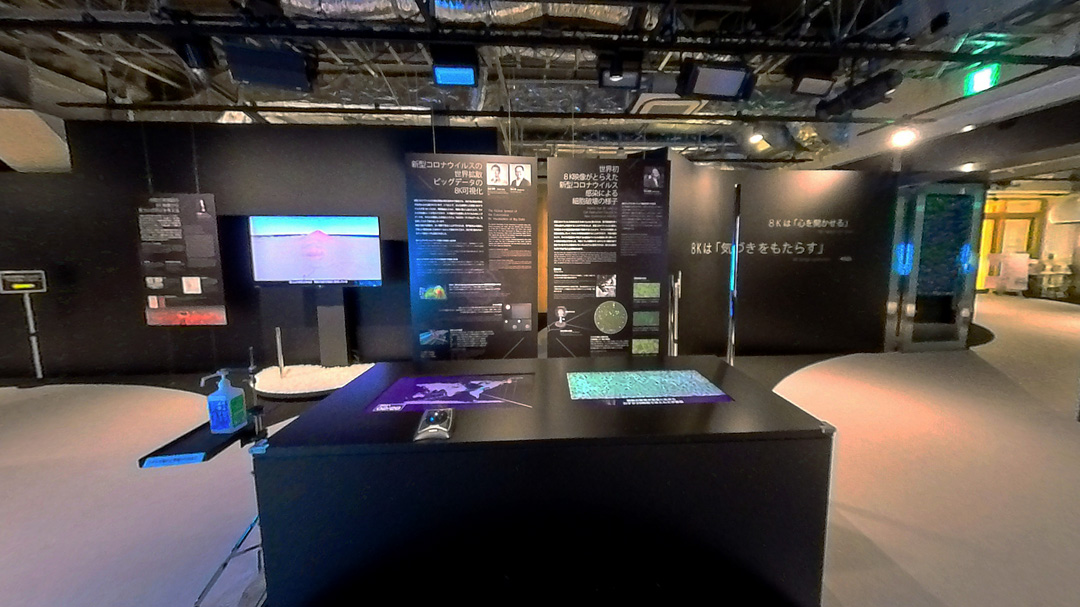
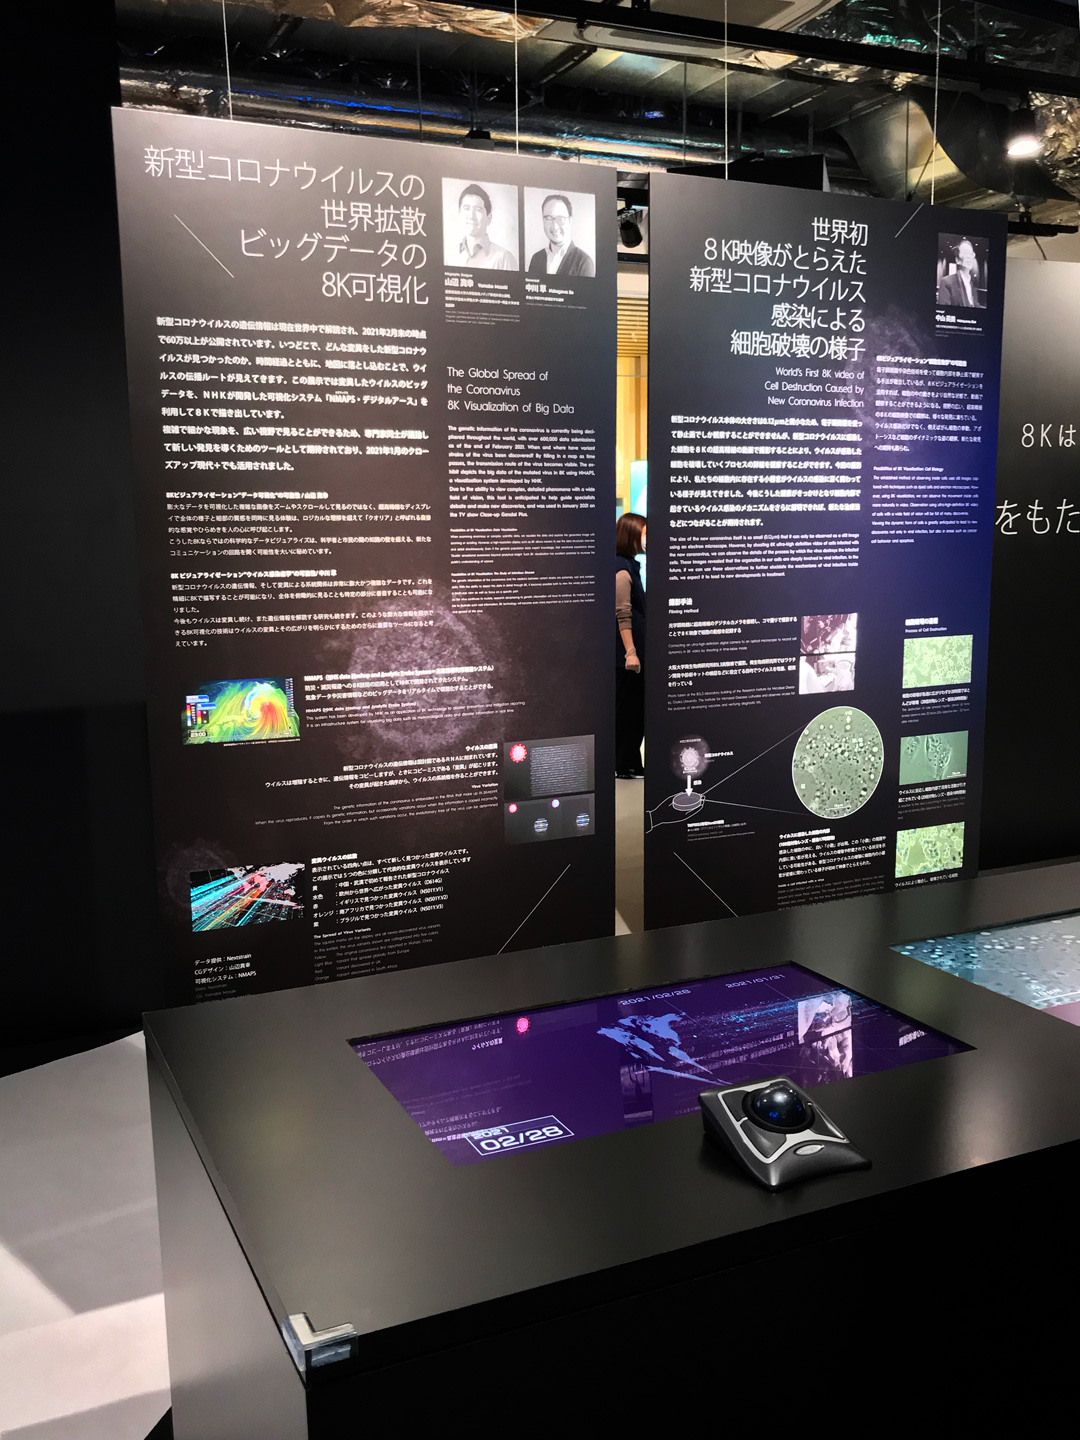
“Resonant Media” The exhibition at NHK Shibuya Plus Cross in Tokyo (2021 Mar.14 – 31)
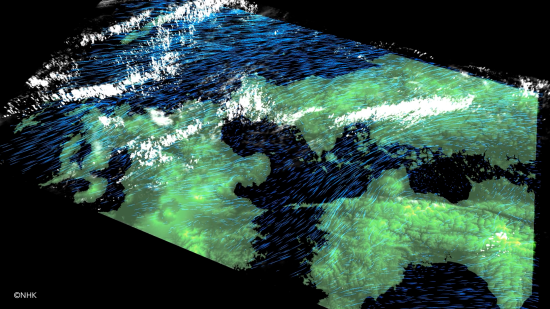
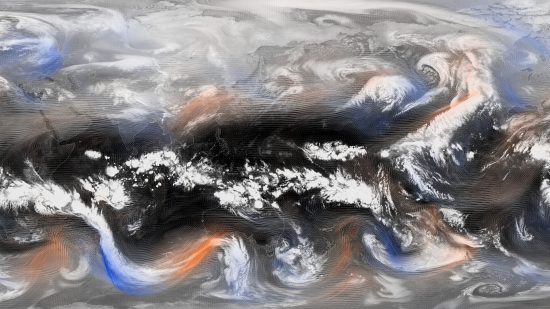
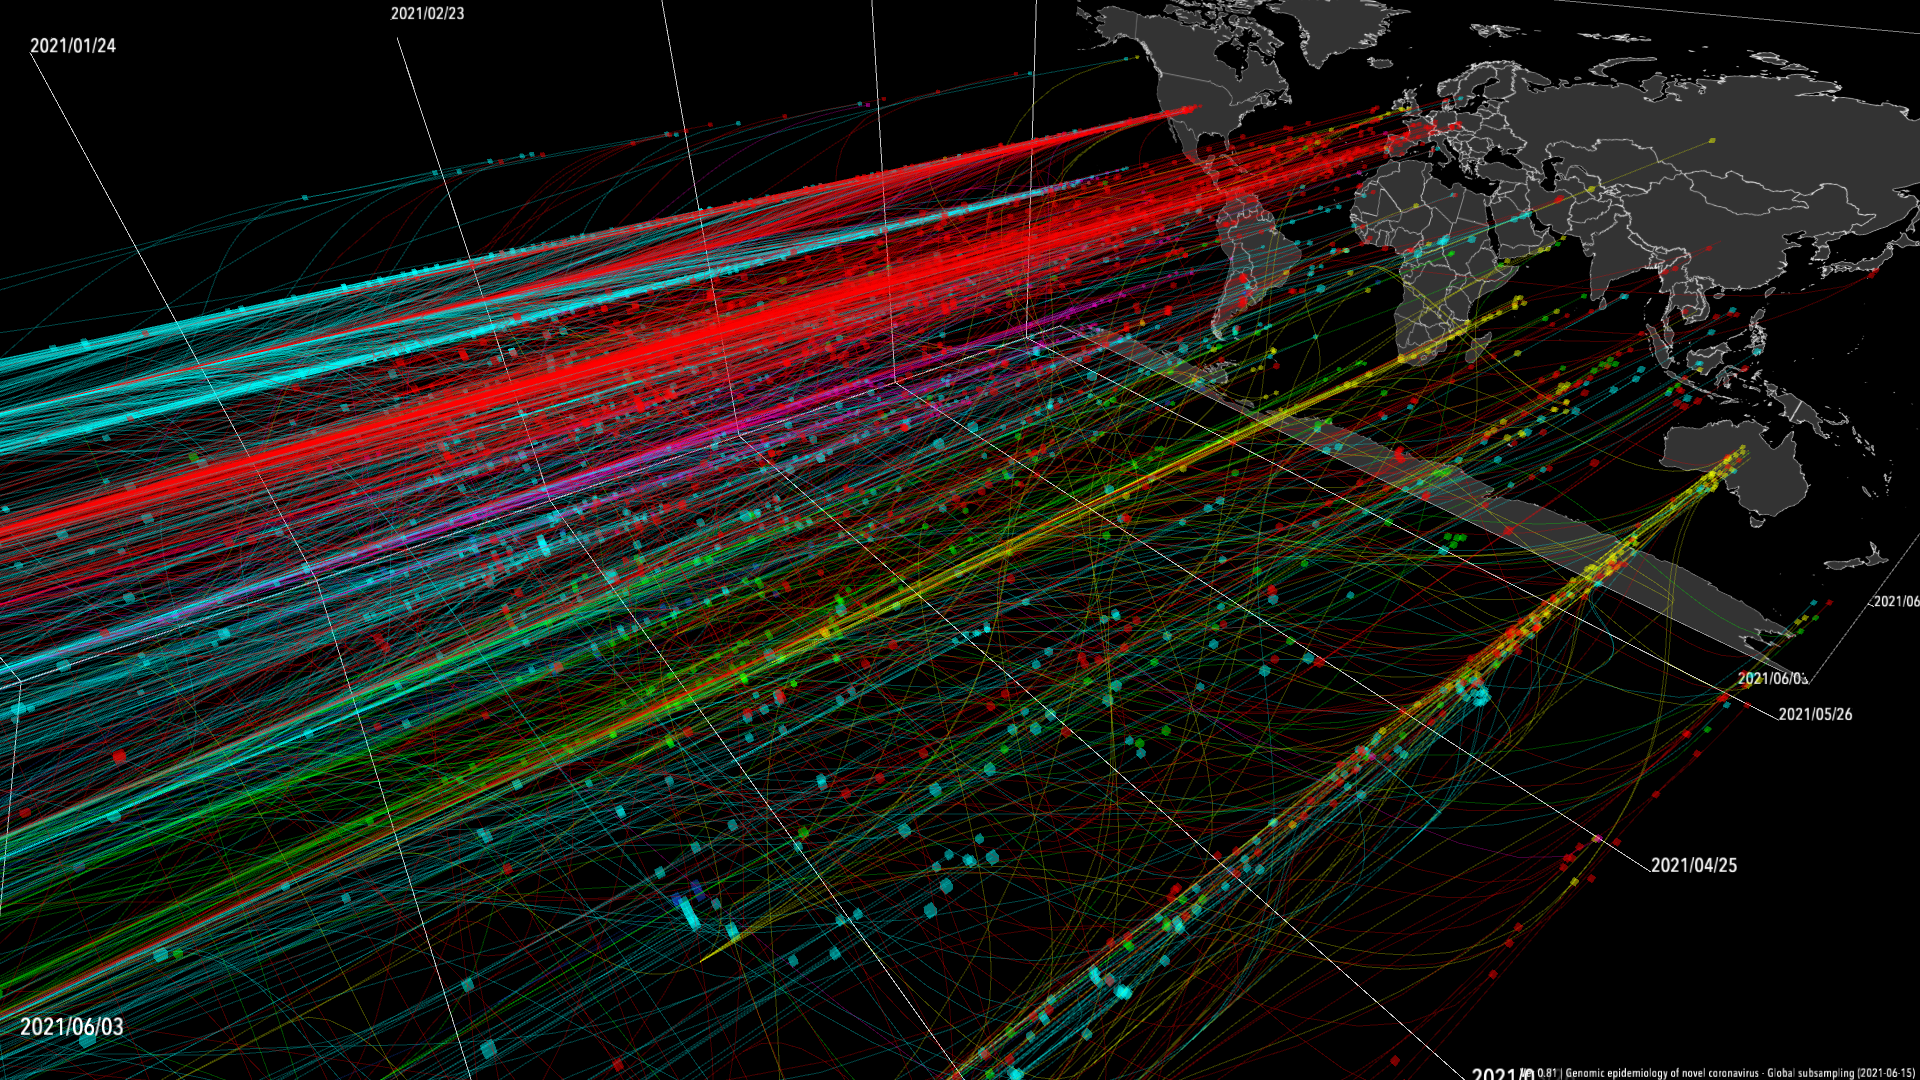
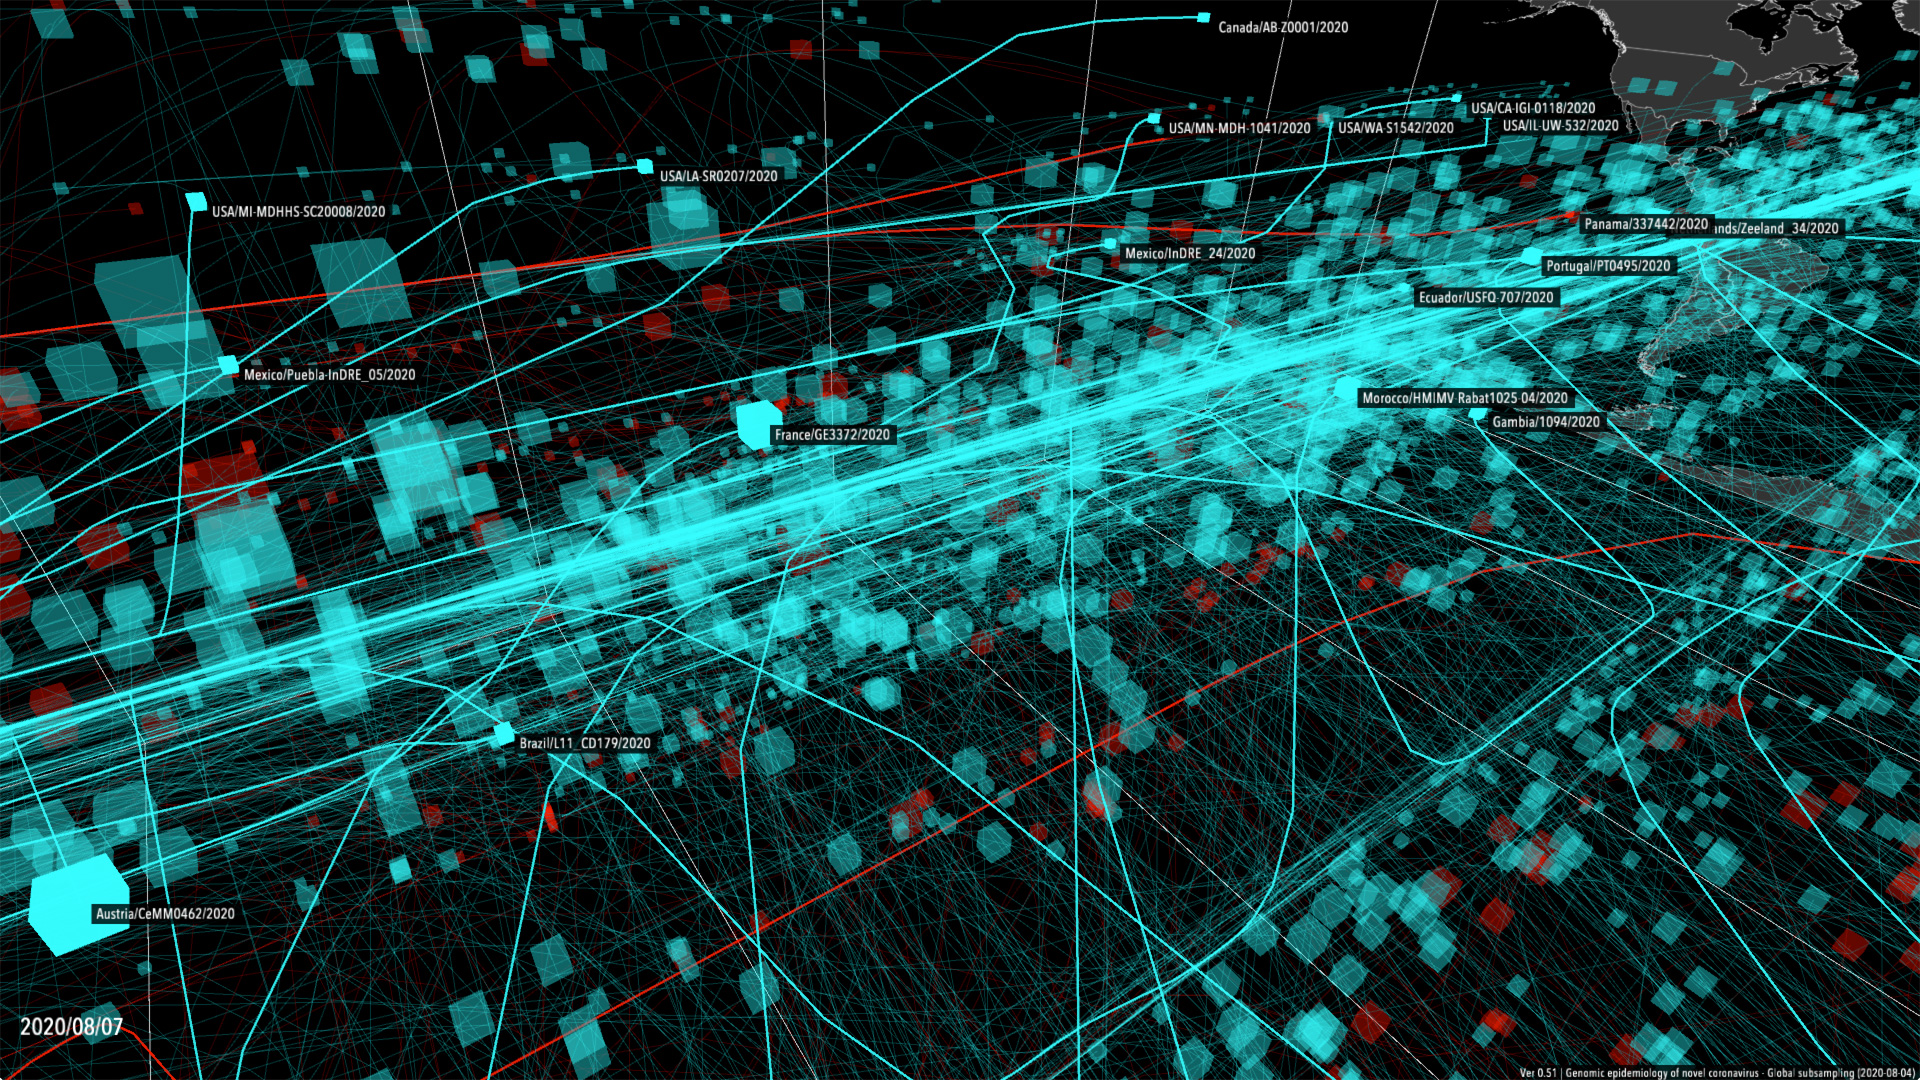
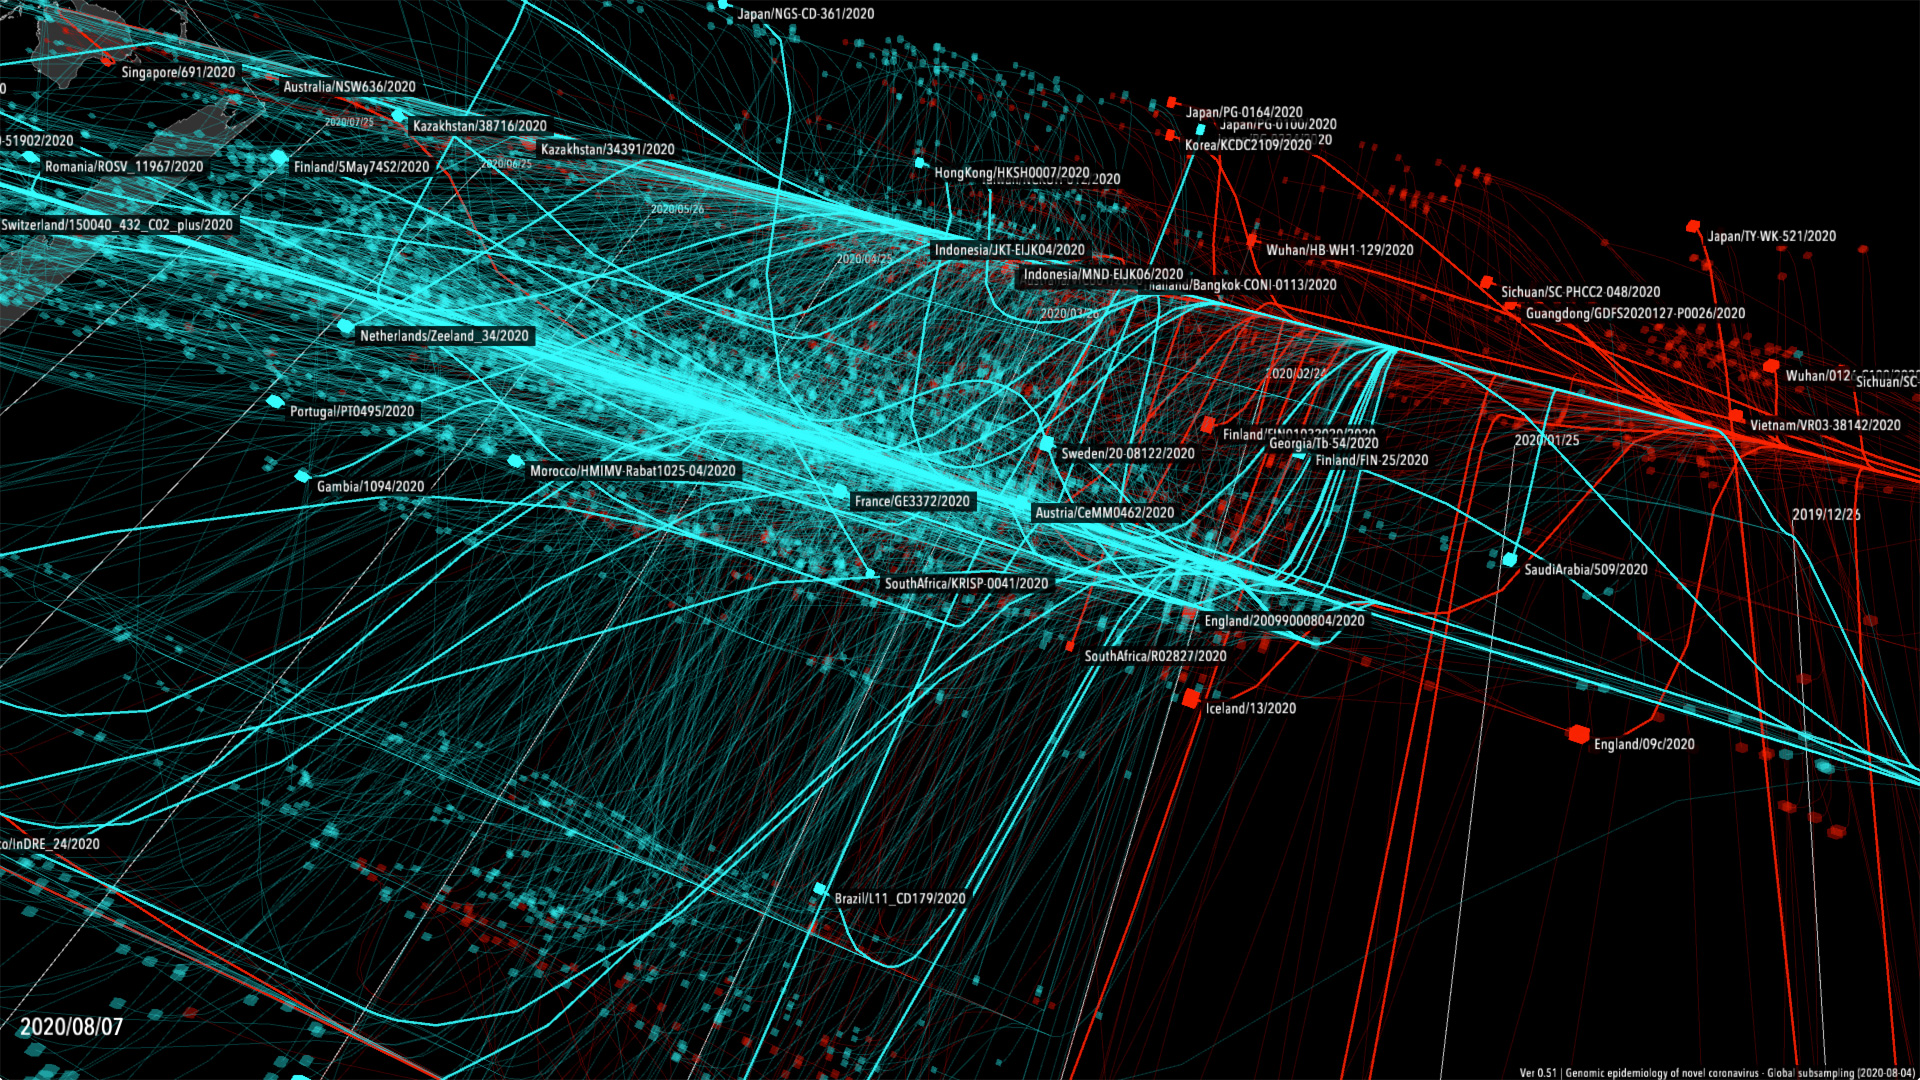
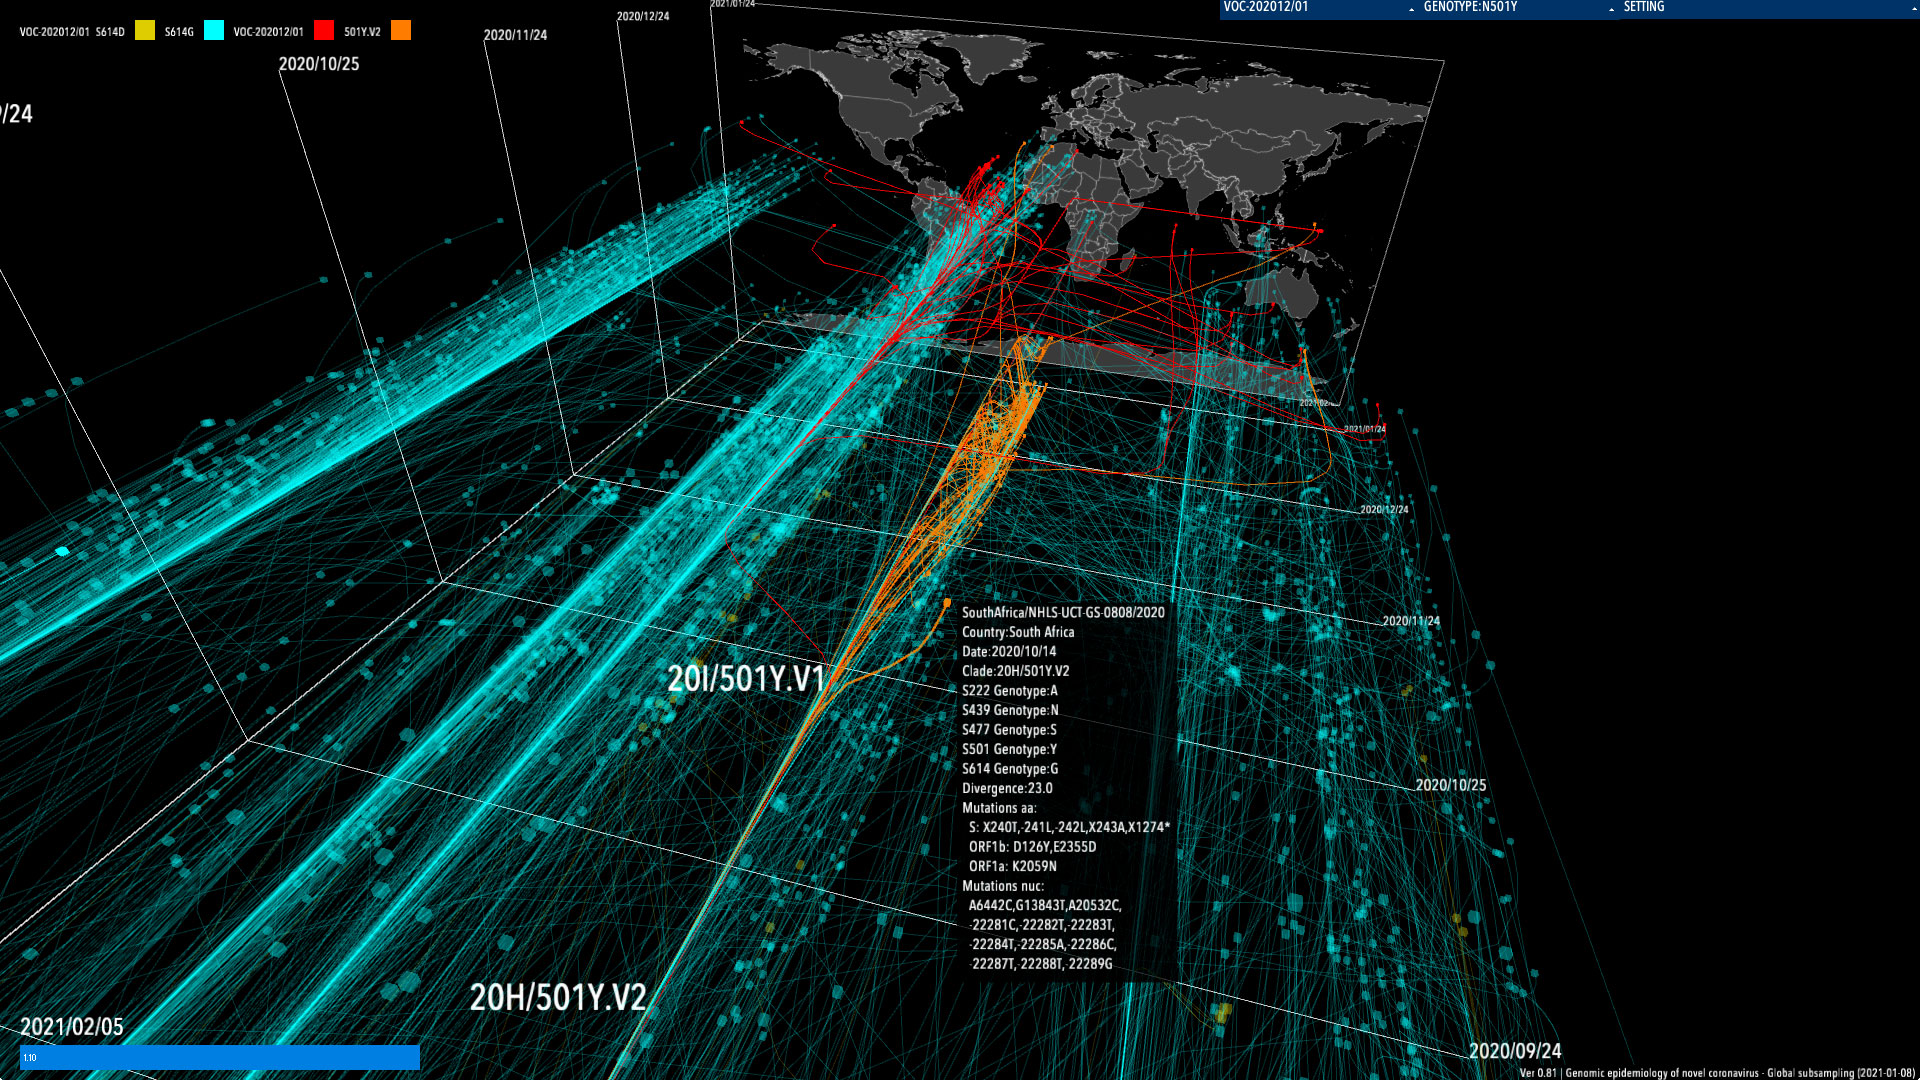
In a global outbreak such as COVID-19, visualization is extremely important, since that promotes scientific understanding based on the available data, even if the general population lacks expert knowledge. Some tools help in visualizing phylogenetic relationships of viruses based on their mutation patterns. However, merely associating phylogenies with time cannot enable full understanding of the geographical spread. Therefore, we proposed a method to associate phylogenies with both time and space, and combine them into a single three-dimensional graph. We applied this method to visualize the phylogeny of SARS-CoV-2 causing COVID-19 to understand their temporal and geographic spread.
We developed the visualization in collaboration with NHK Educational Corporation and So Nakagawa, a lecturer at Tokai University School of Medicine. NHK, the Japanese Broadcasting Company, implemented this visualization design into its big data visualization system “NMAPS.” It was broadcasted in the 4K and 8K (ultra-high-definition) TV program by NHK.
We introduced our methods, materials, and evaluations at VISUALIZING BIOLOGICAL DATA (VIZBI) in 2021. Also, Our interactive visualization software with 8K was exhibited at “Resonant Media” in Tokyo in 2021. This event was conducted through collaboration with Ars Electronica Futurelab and NHK. For more detail, click on the link below.
The poster presentation at VIZBI 2021
Youtube Live NHK meets Ars Electronica Futurelab – Resonant Media
The website of this project
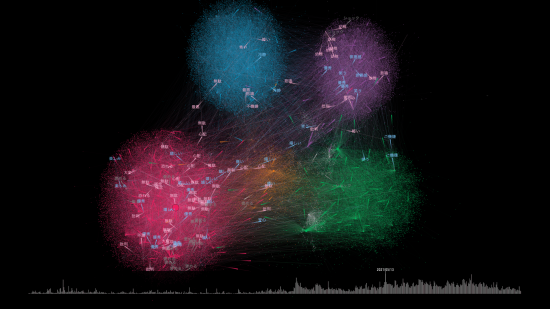
2020年初頭から世界で拡大を続ける新型コロナウイルス(SARS-CoV-2)は変異を繰り返している。世界各地で報告される変異はオープンデータベースに登録され疫学的な解析やワクチンの研究に供される。(GISAIDはそうしたオープンソースプロジェクトの代表的な存在の一つである。)
一般的に変異系統樹は時間軸や変異数軸によって2次元的に可視化されることが多いが、これらの可視化手法では地理的な広がりを理解することは難しい。そのため、このプロジェクトでは変異の採取地情報をもとに系統樹を時間と空間に結びつけて可視化し、3次元的に表現することで地理的な解析を可能にしている。また、感染が拡大している注意すべき変異株=VOIについては社会的関心が極めて高く、このような系統の動向を一般市民に向けてわかりやすく提供する情報可視化手法として放送や展示に積極的に活用している。
このビジュアライズは東海大学医学部講師中川草氏他、多大なるご助言とご指導のもとに開発を進め、NHKが有するビッグデータ可視化システム「NMAPS」の一部としても運用中である。現在まで、NHK 総合テレビ、BS4K、BS8Kで放映された下記に記す番組で使用された。
NHKクローズアップ現代+「変異ウイルス・感染拡大を防ぐには?▽ビッグデータで分析」
NHKクローズアップ現代+「ビッグデータで読み解く 新型コロナの“今後”」
NHKスペシャル「新型コロナ“第3波” 危機は乗り切れるのか」
NHK BS4K,BS8K「ビッグデータで読み解く 新型コロナウイルス感染爆発」
2021年、欧州分子生物学研究所が主催する国際会議「VIZBI2021」にてポスター発表「Time-space-based visualization of SARS-CoV-2 phylogeny」を行った。
2021年、NHKとArs ElectronicaFuturelabの共同企画展覧会「共鳴するメディア-8Kビジュアライゼーションの可能性」にて8Kシステムでのインタラクティブ展示を行った。Ars Electronica Futurelabによる関連イベント「Resonant Media」はYoutubeLiveで配信された。
2021年、本プロジェクトのサイトを公開した。
(※画面は開発中のもので放送内容とは異なります。)
Visualization
Design and development: Masaki Yamabe
Scientific Advisor: So Nakagawa
Dataset
GISAID