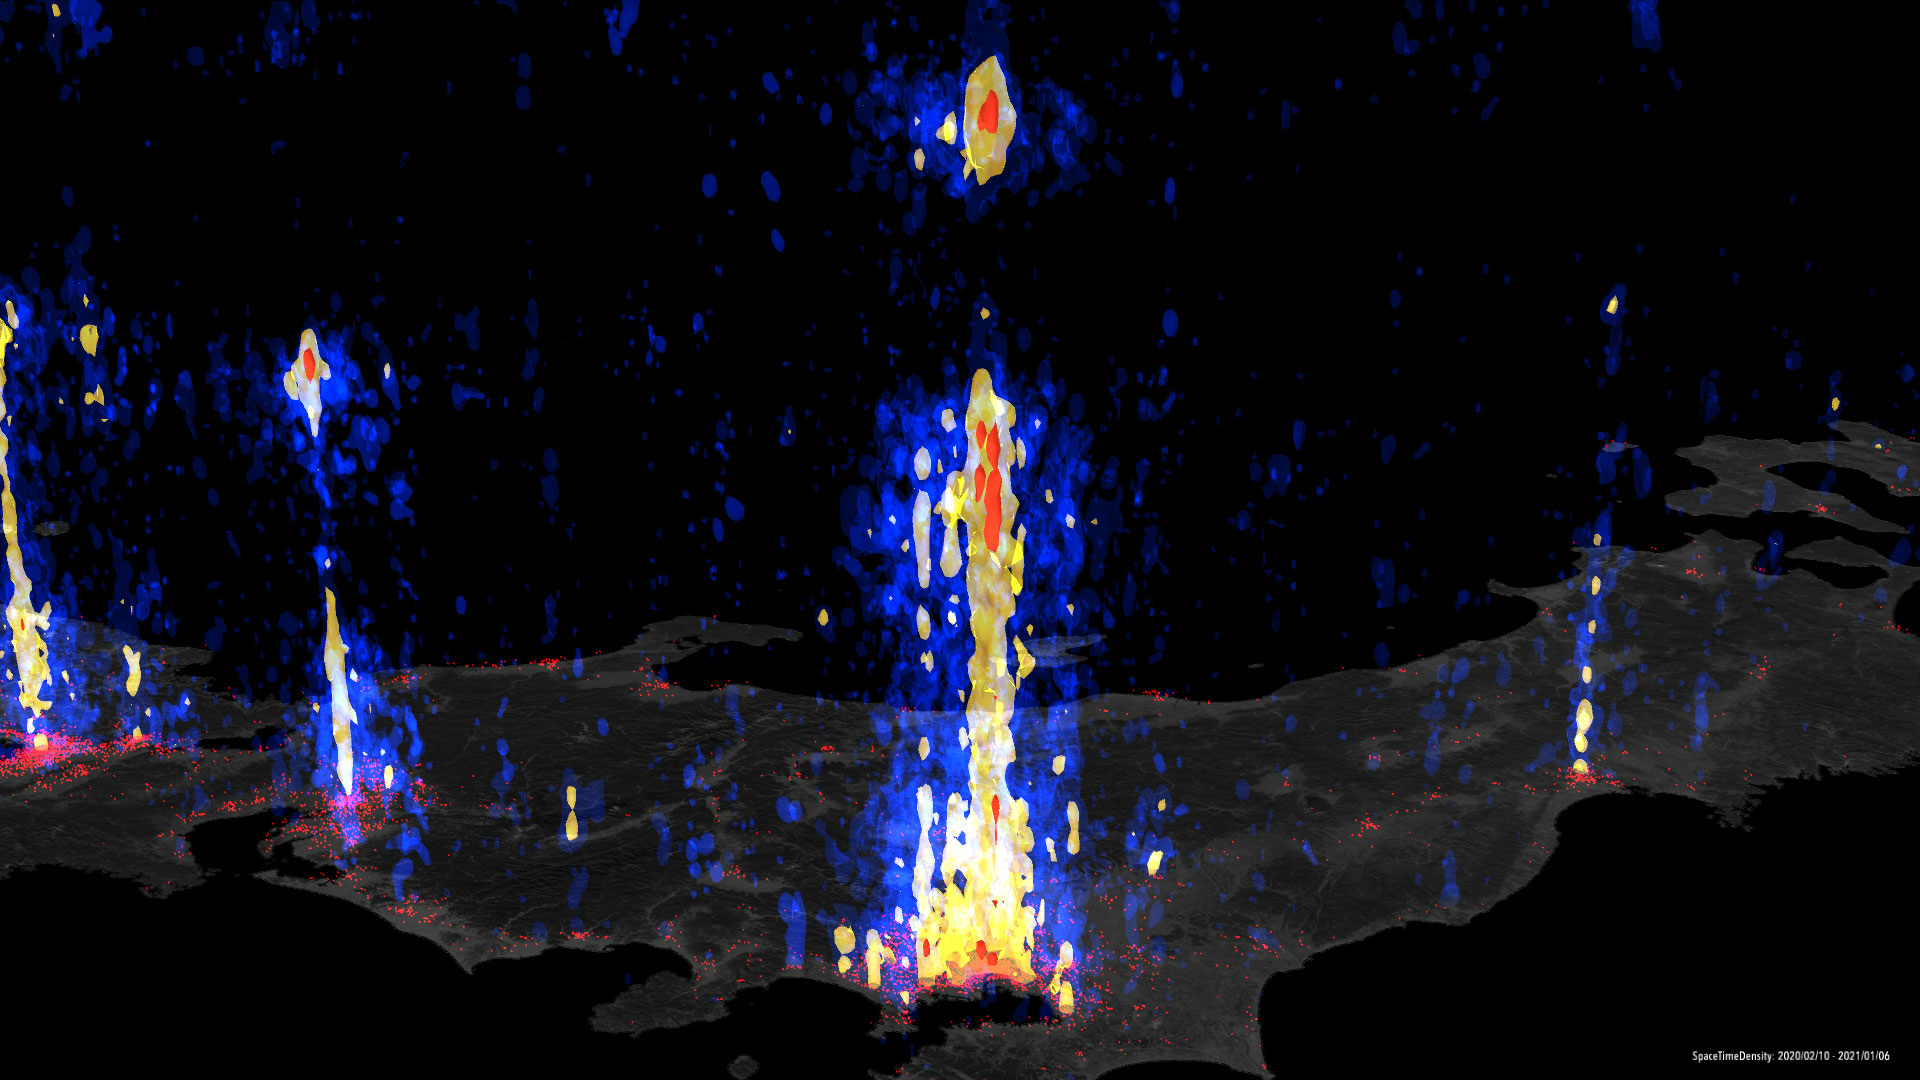
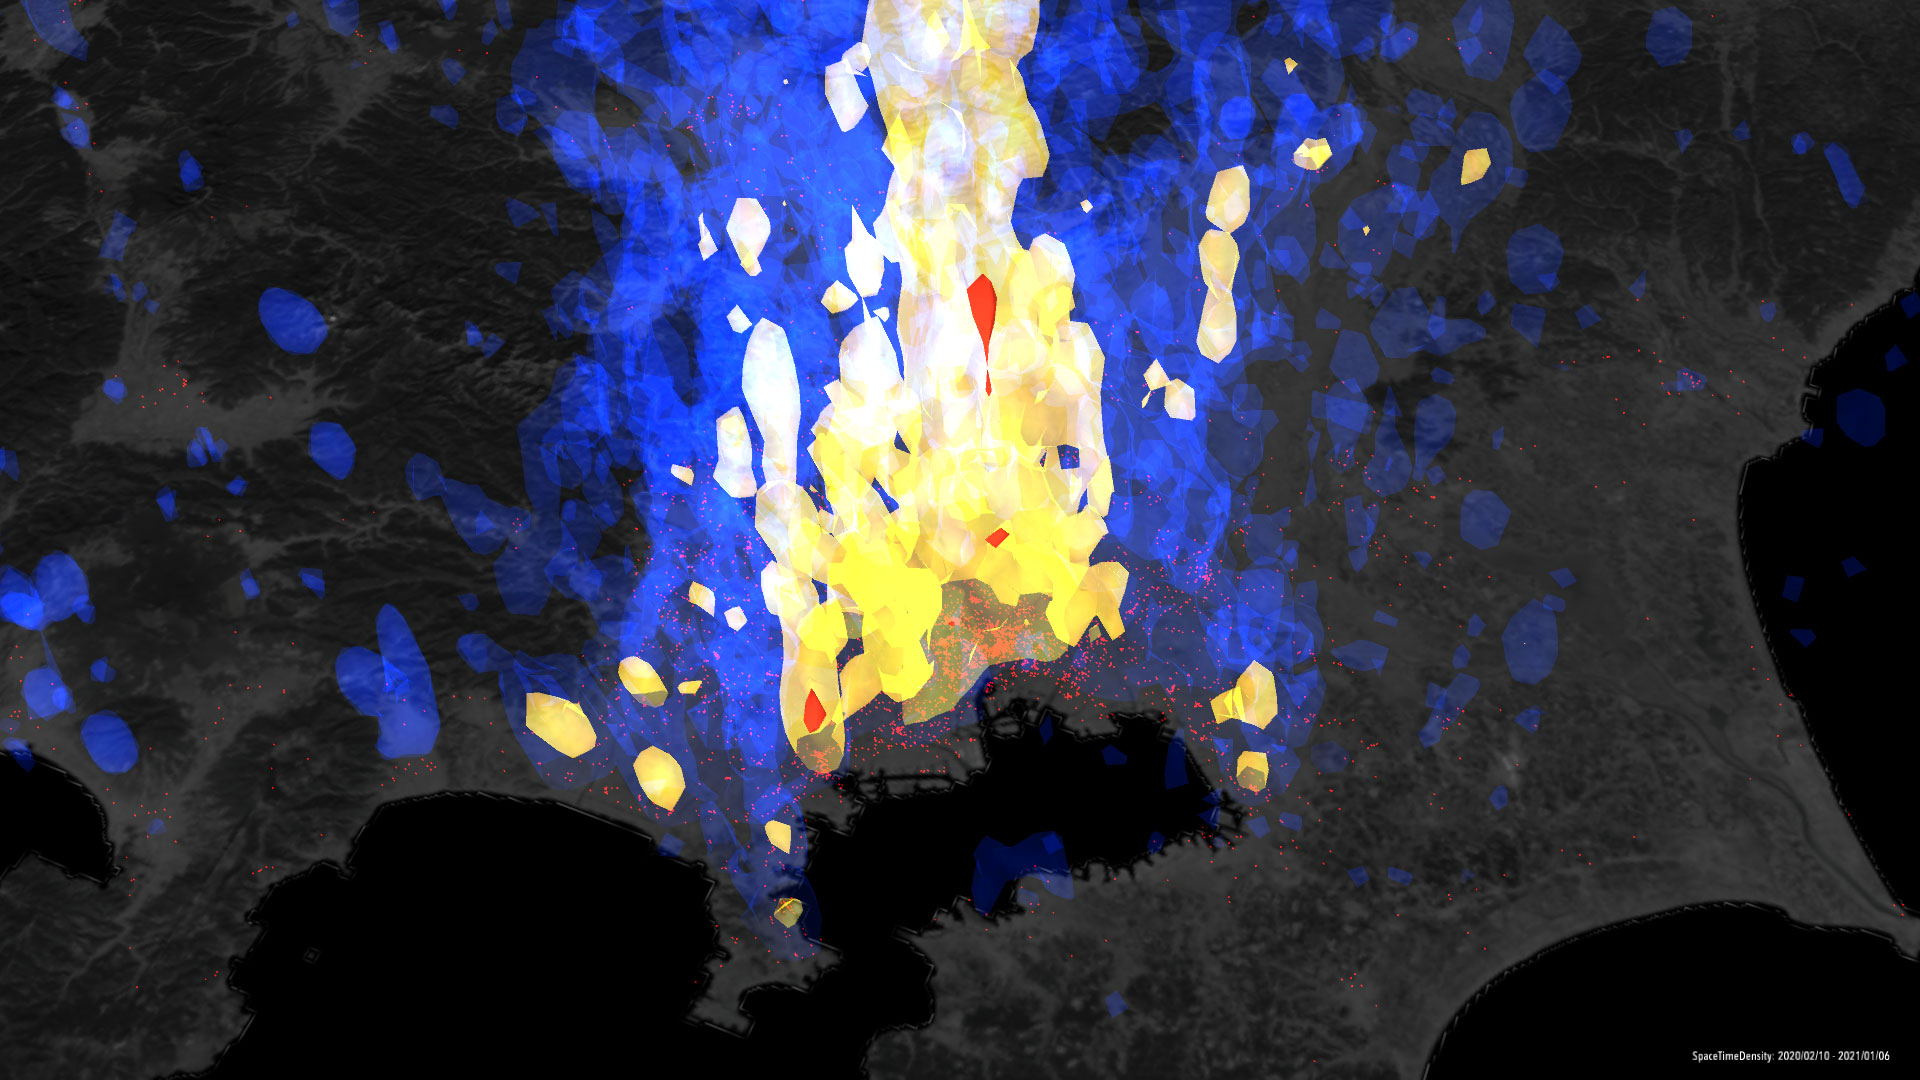
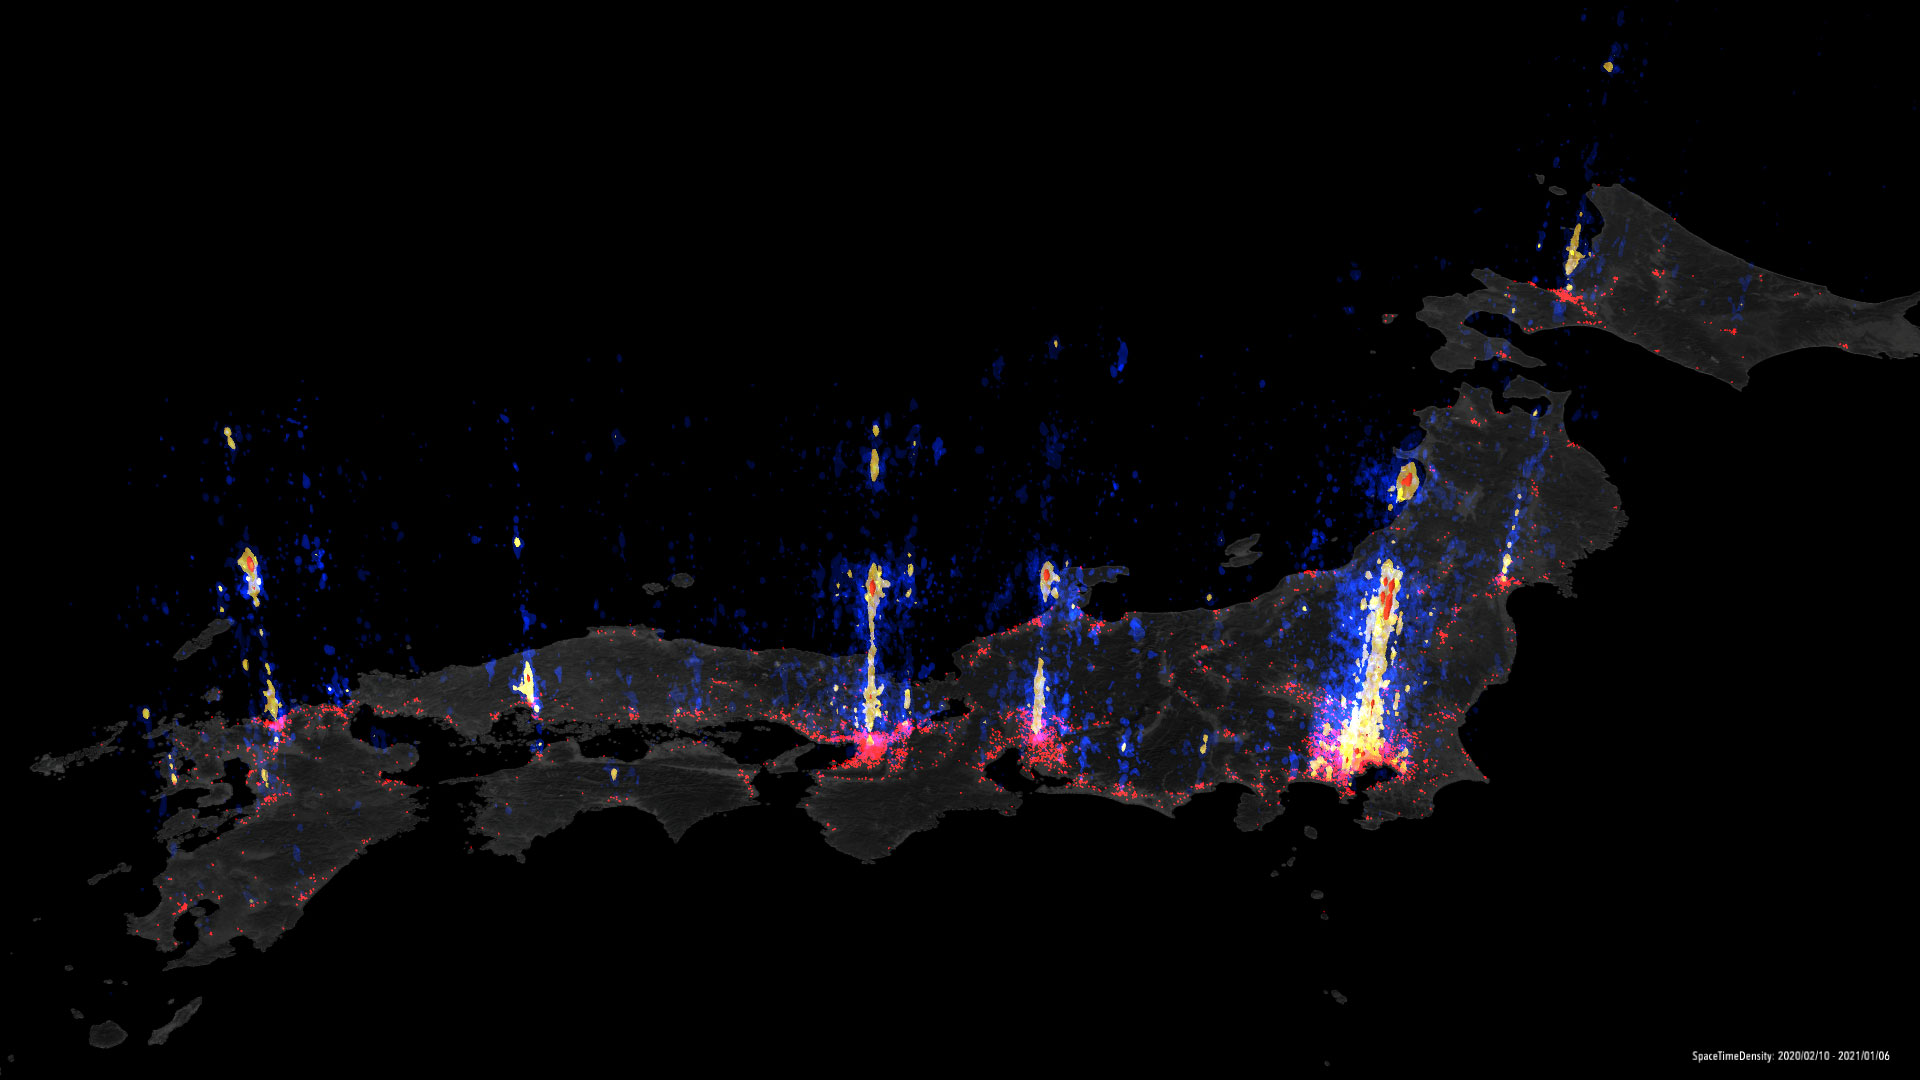
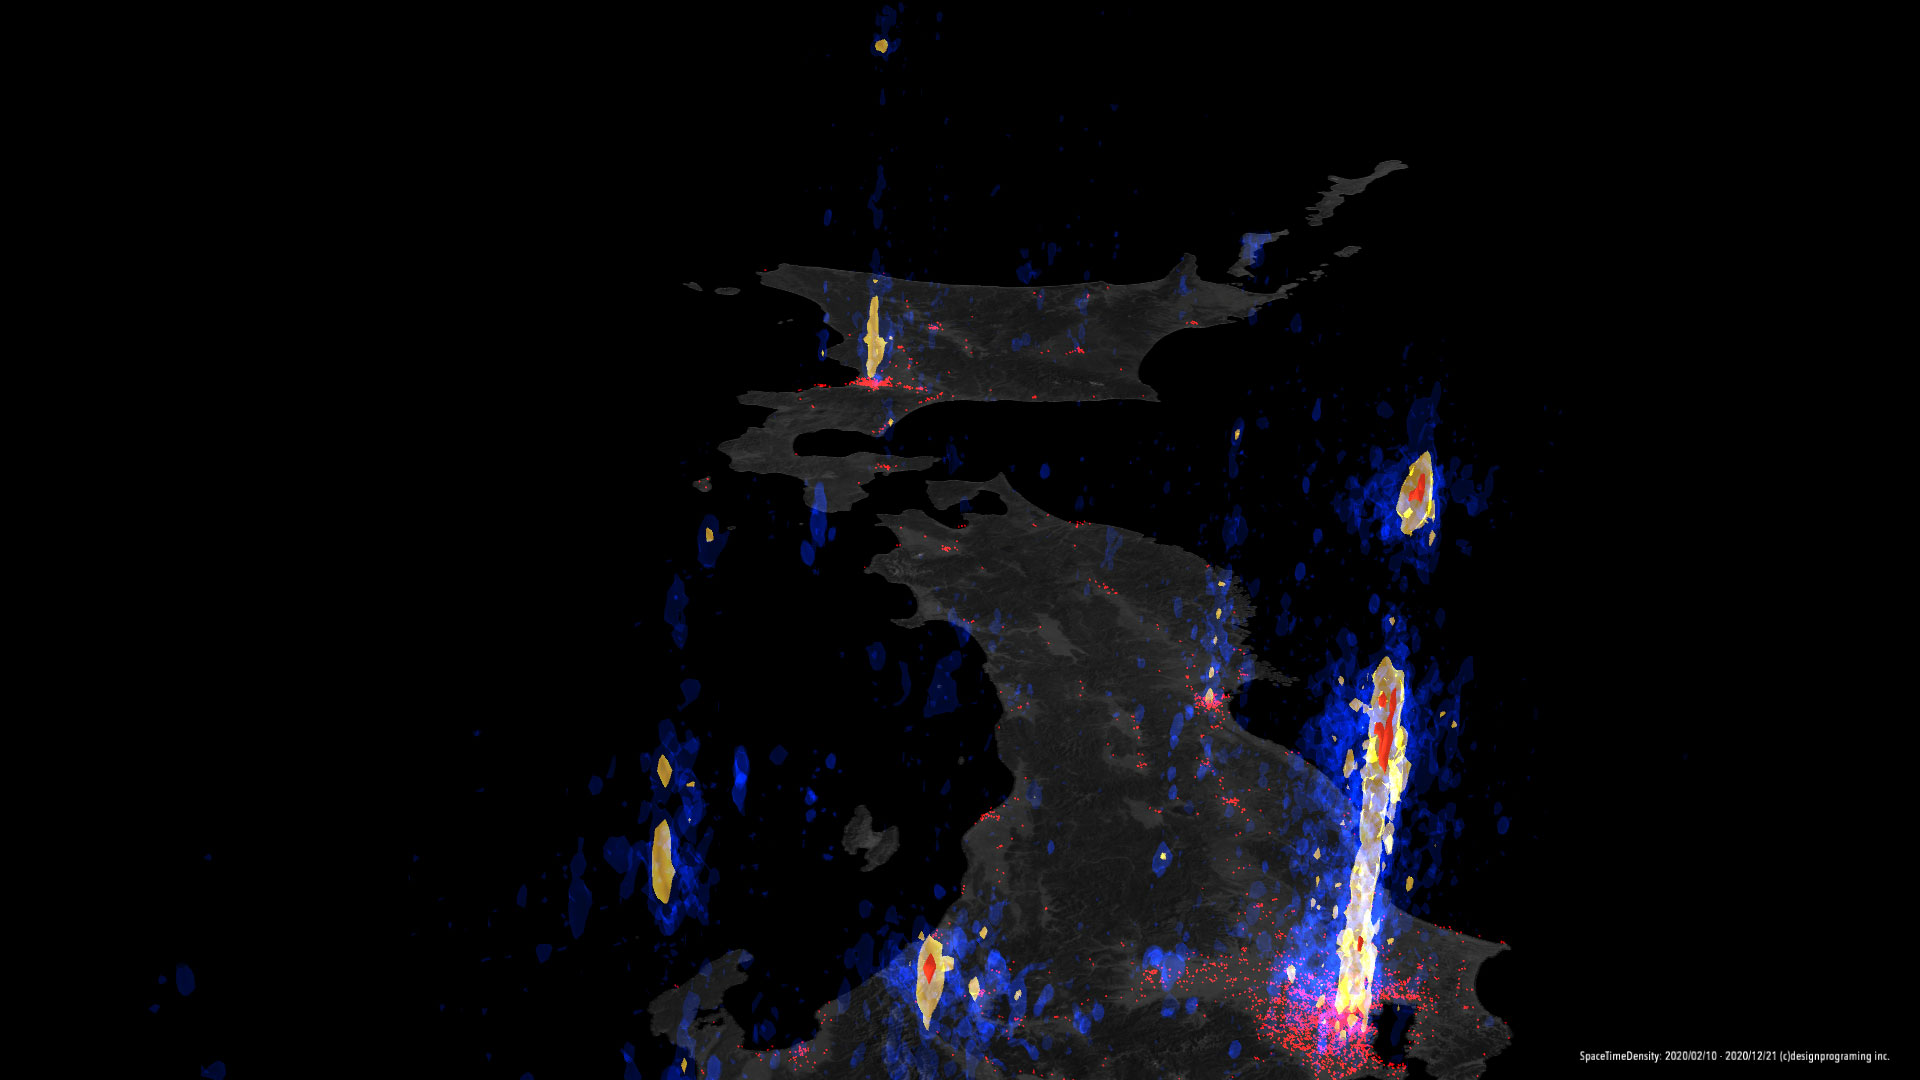
This three-dimensional graph shows the risk of infection based on the location information of COVID-19 cases reported in Japan between March 2020 and December 2020.
The about 12,000 dots on a map indicate the locations of cases. The height from the ground surface indicates the date of the reported cases. For example, a height of 0 meters corresponds to December 31, and each rise of about 500 meters indicates one day earlier.
The objects, such as a bubble, above many cities visualize the density of infection risk.
The colors of the objects indicate the risk level:
Red: Five or more cases occurred per day within a four-square-kilometer area.
Yellow: One or more cases occurred per day within a four-square-kilometer area.
Blue: One or more cases occurred per four days within a four-square-kilometer area.
In the early days, the highest risk appeared in crowded areas of the city center. Then the highest risk decreased over time, and slightly higher risks spread to the suburbs through the transportation network.
Credit
Data visualization by Masaki Yamabe (Keio University)
Scientific advisor and technical support by Tomoki Nakaya (Tohoku University)
Scientific research support by NHK and NHK Educational Corp.
Data provided by JX PRESS Corp.
新型コロナウイルスの感染発生報告を蓄積した位置情報ビッグデータを使用して、日本全国の感染のリスクを可視化した。
この可視化では時間を高さで表し(地表に近いほど現在に近く、上空に向かうほど過去)、地理的な感染の密度だけでなく時間的な密度も表現している。赤色は毎日5箇所以上、黄色は毎日1カ所以上、青は4日に1カ所程度の感染が発生するエリアを示しており、地域によって感染が連続して発生していることを示している。
これにより、第1波と第2波の間では全国的にリスクが低く抑えられたものの、特に都市部において第2波に続く期間のリスクが途切れず拡大していることがわかる。
東北大学大学院中谷友樹教授らが開発したこのアルゴリズムの提供を受け、私とNHKのチームでは8Kの高解像度表示のためのシステム「NMAPS」での可視化と映像化を行った。制作した映像は、NHKスペシャル「新型コロナ“第3波” 危機は乗り切れるのか」、NHKクローズアップ現代+「ビッグデータで読み解く 新型コロナの“今後”」で放送された。
(掲載した画像は開発中のもので放送とは異なります)
Credit
取材・制作:©NHK、NHKエデュケーショナル
データ提供:JX通信社
データ分析・解説:東北大学大学院中谷友樹教授
システム開発:NHKメディア開発企画センター、株式会社カシカ
ビジュアライズデザイン・開発:山辺真幸