コロナ禍のツイート―感情はどう広がるのか?
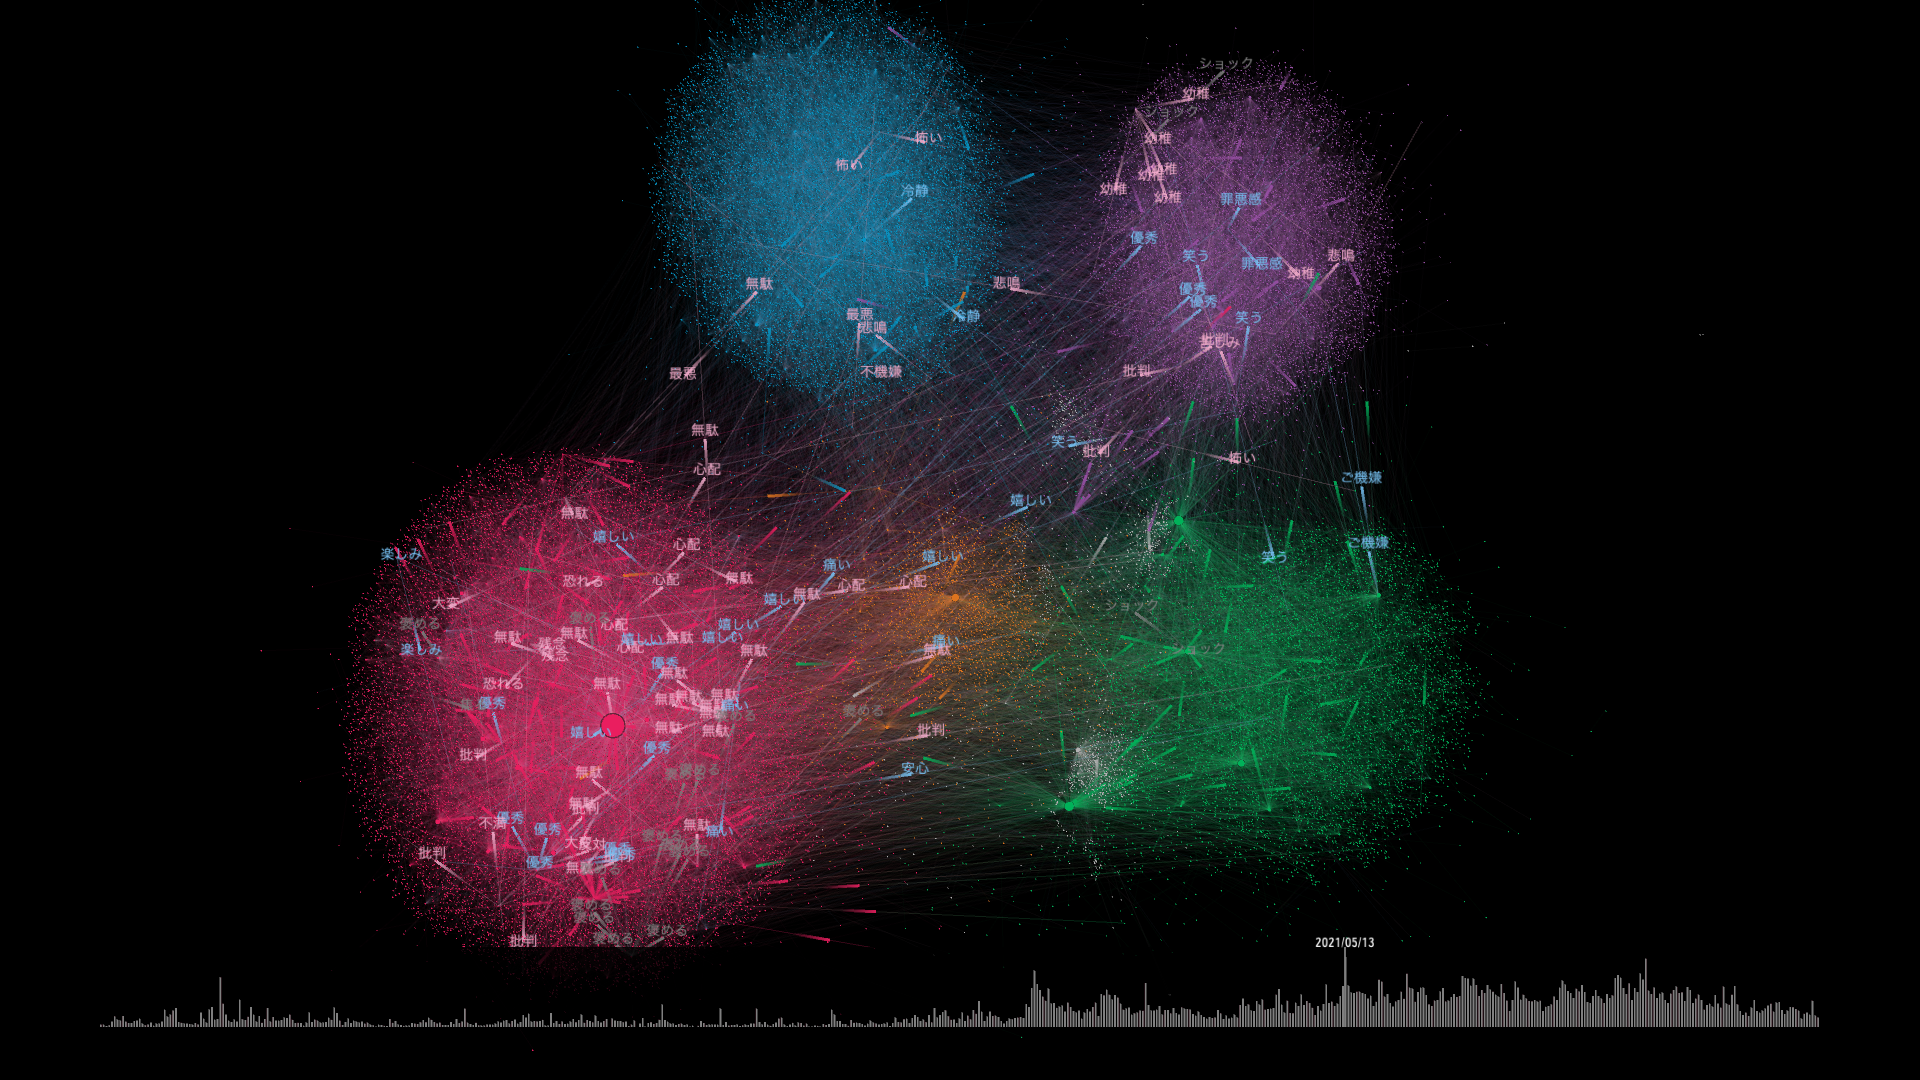
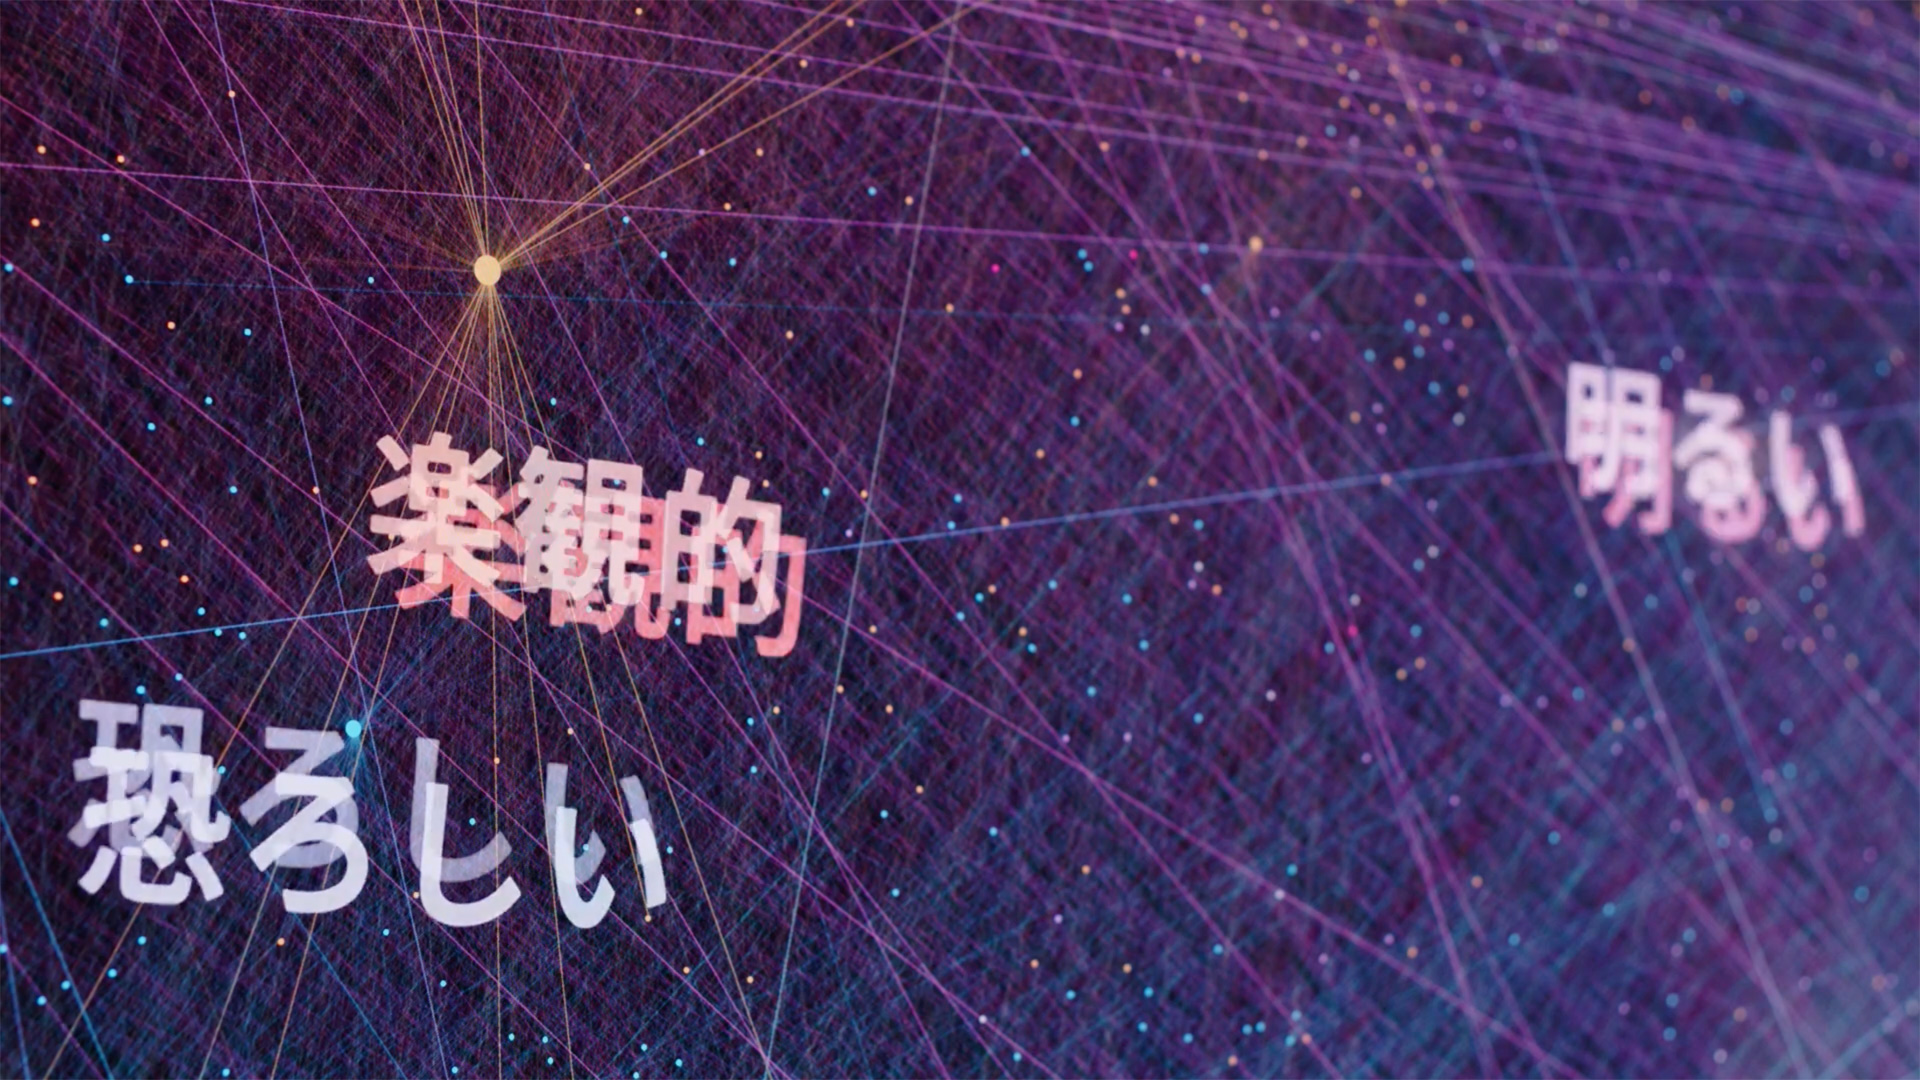
約30万件のツイートを8Kで可視化した。ひとつの点はアカウントを表し、ツイートの内容を解析した結果から、似通った意見を持つアカウントは同じ色で近くに配置される。この図ではアカウントが5つにグループ分けされている。あるアカウントのツイートを別のアカウントがリツイートするとアカウント同士が線で結ばれ、ツイート内のテキストから分析された「感情」は、アカウント間を飛び交う文字の色で表現される(肯定的な場合は寒色系、否定的な場合は暖色系)。
How do emotions spread within social networks?
User interactions on social media platforms, including comments, likes, and shares, offer insights into their sentiments towards various topics. Leveraging a dataset of 300,000 COVID-19-related tweets from Twitter, we conducted an analysis to visualize the distribution of users expressing similar emotions across the network and examine how these emotions propagate. Our visualization reveals five distinct clusters representing various user perspectives. These clusters capture different tendencies and inclinations regarding the topic under consideration, providing insights into the diverse range of viewpoints within the network. Each data point on the plot represents a user account, color-coded to signify their respective cluster. Lines connecting the points indicate interactions such as retweets or replies. Additionally, words like “fear” or “satisfied” along these lines reflect the emotional context inferred from the message content. Positive emotions are depicted in blue, while negative emotions are denoted in red. As users engage with content through replies or retweets, emotions—both positive and negative—are transferred from the original source to the user. In instances of viral content, emotional reactions create significant ripple effects throughout the network.
Team
データ分析・提供:笹原和俊(東京工業大学)、橋本康弘(会津大学)、宮崎邦洋(東京大学)
ビジュアライゼーションデザイン: 山辺真幸
システム開発: 株式会社カシカ
制作:NHK, NHK エデュケーショナル
Data analysis:Kazutoshi Sasahara(Tokyo Institute of Technology), Yasuhiro Hashimoto(Aizu University), Kunihiro Miyazaki(University of Tokyo)
Visualization Design: Masaki Yamabe
System Development: KASHIKA Inc.
Produce:NHK, NHK Educational Corp.
©NHK