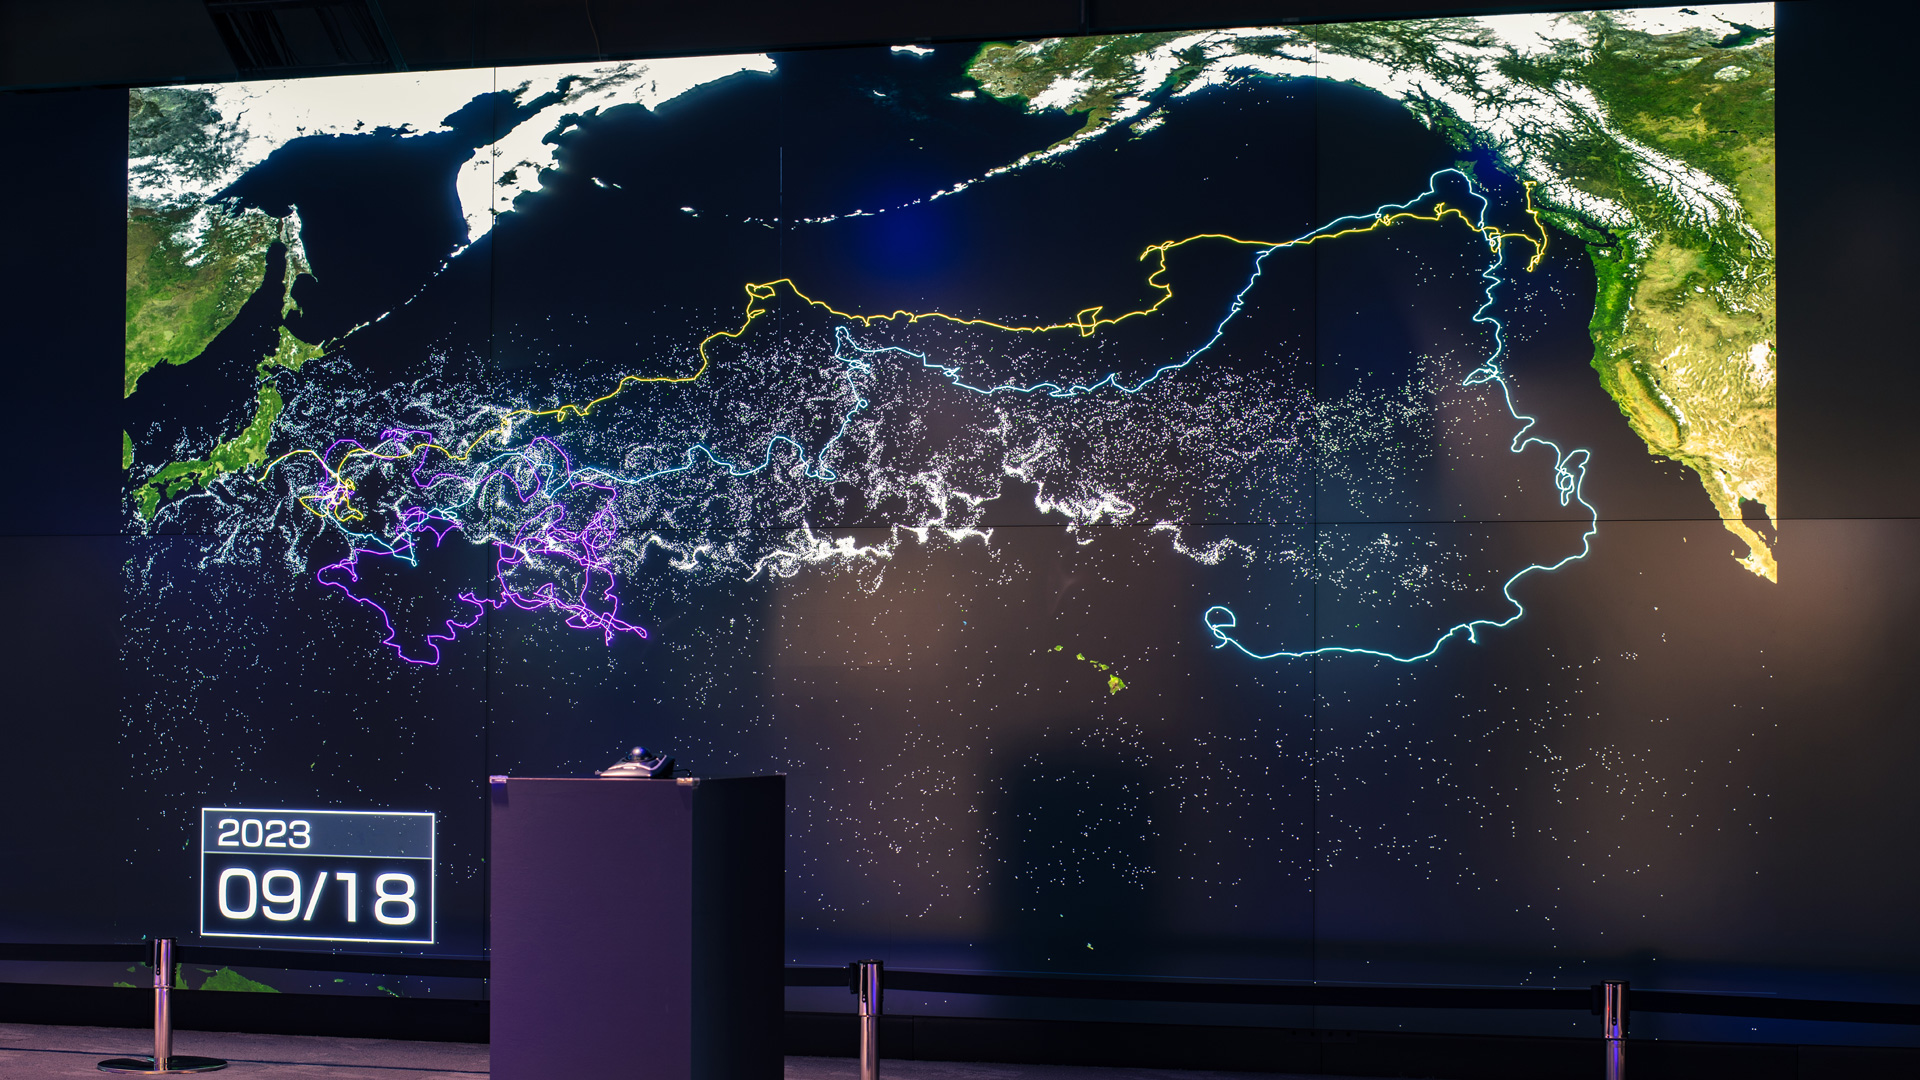
This project aims to visualize microplastics spreading from East Asia to the Pacific Ocean to understand the pollution’s impact.
Plastics broken up into 5 mm pieces are called microplastics and come from discarded plastic products.
Large amounts of microplastics drift in the ocean and sink to the seafloor after about three years.
It has become a serious problem because marine organisms ingest these microplastics, causing stress, and the adsorbed pollutants significantly impact the ecosystem.
Professor Atsuhiko Isobe and his colleagues at the Center for Oceanic and Atmospheric Research of Kyushu University are developing a model to predict the amount of microplastics suspended and drifting in the ocean by combining an analysis of samples collected in the sea with numerical simulations.
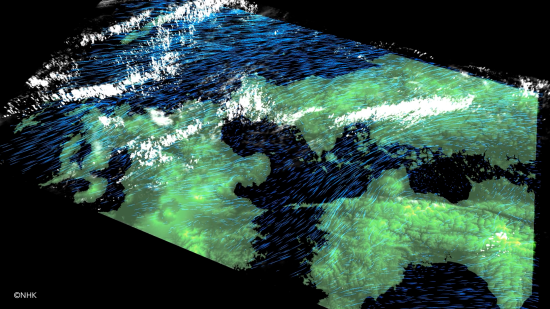
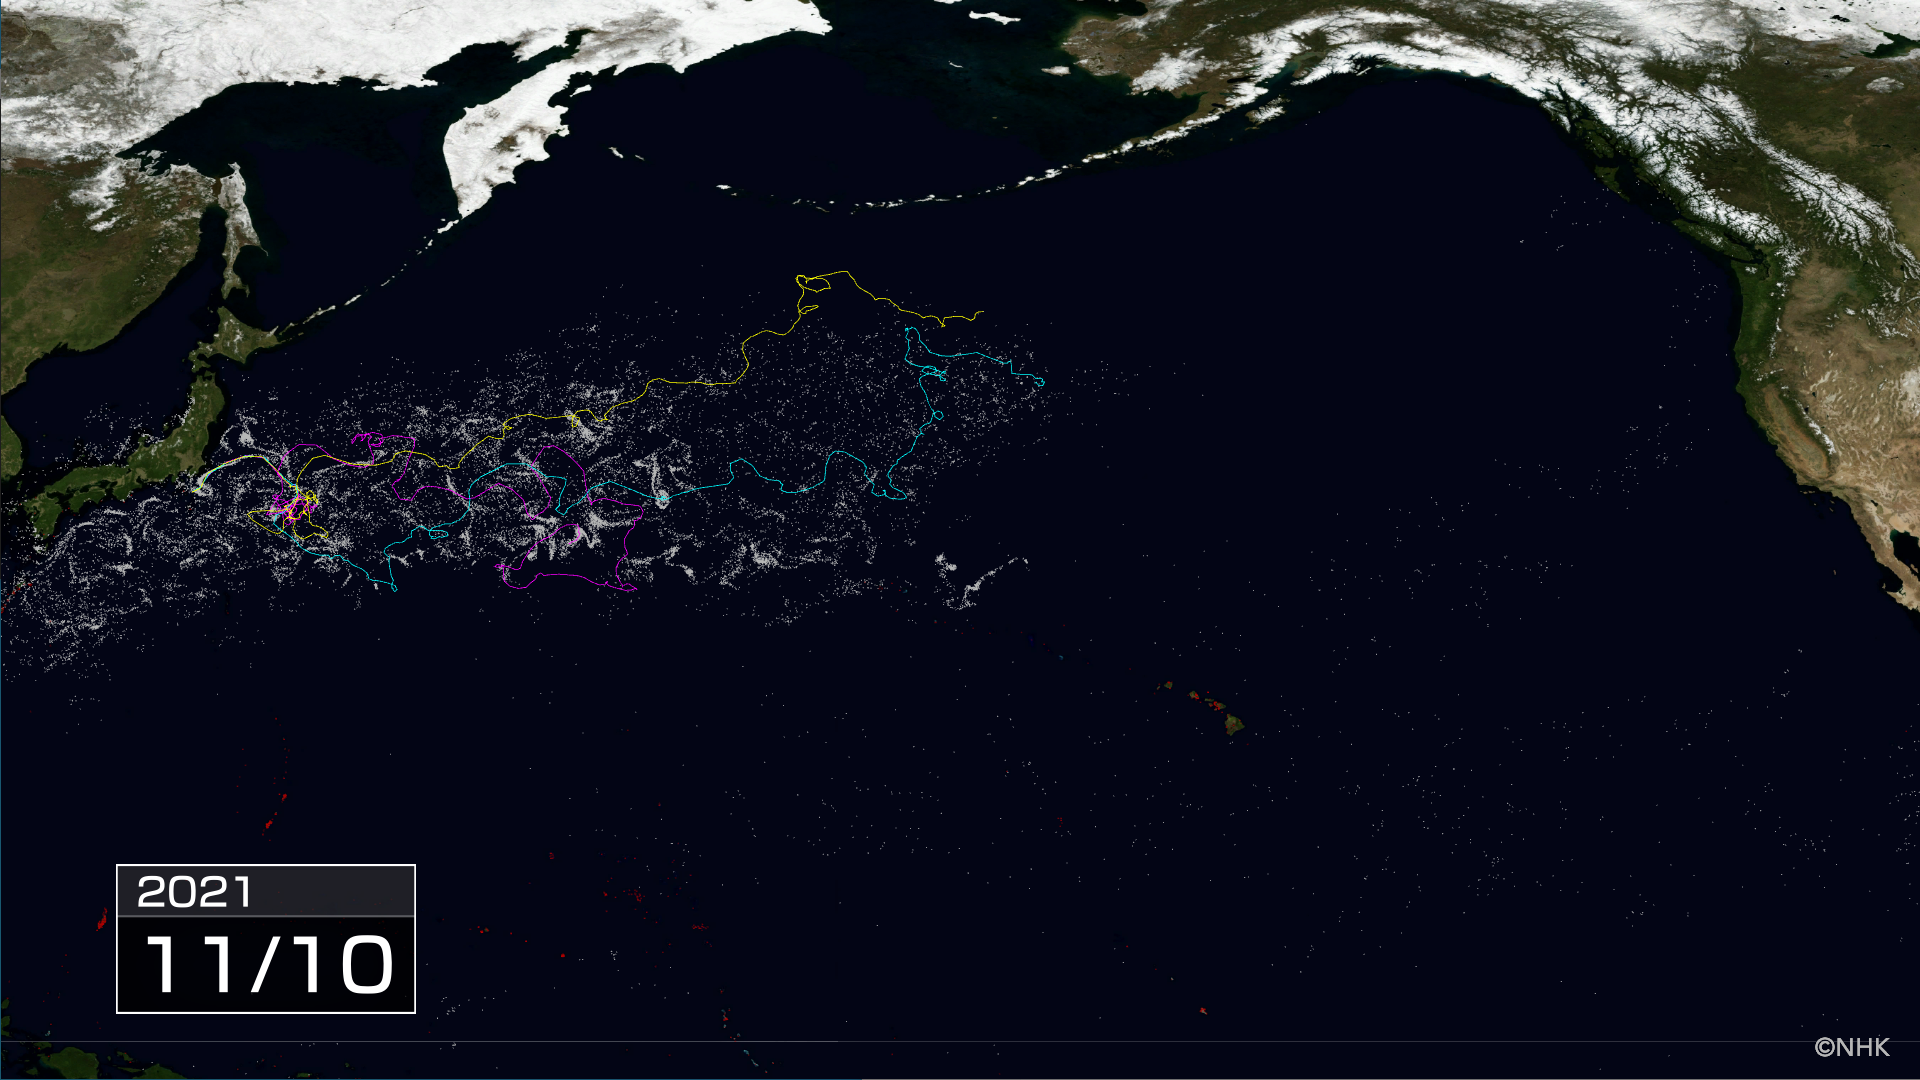
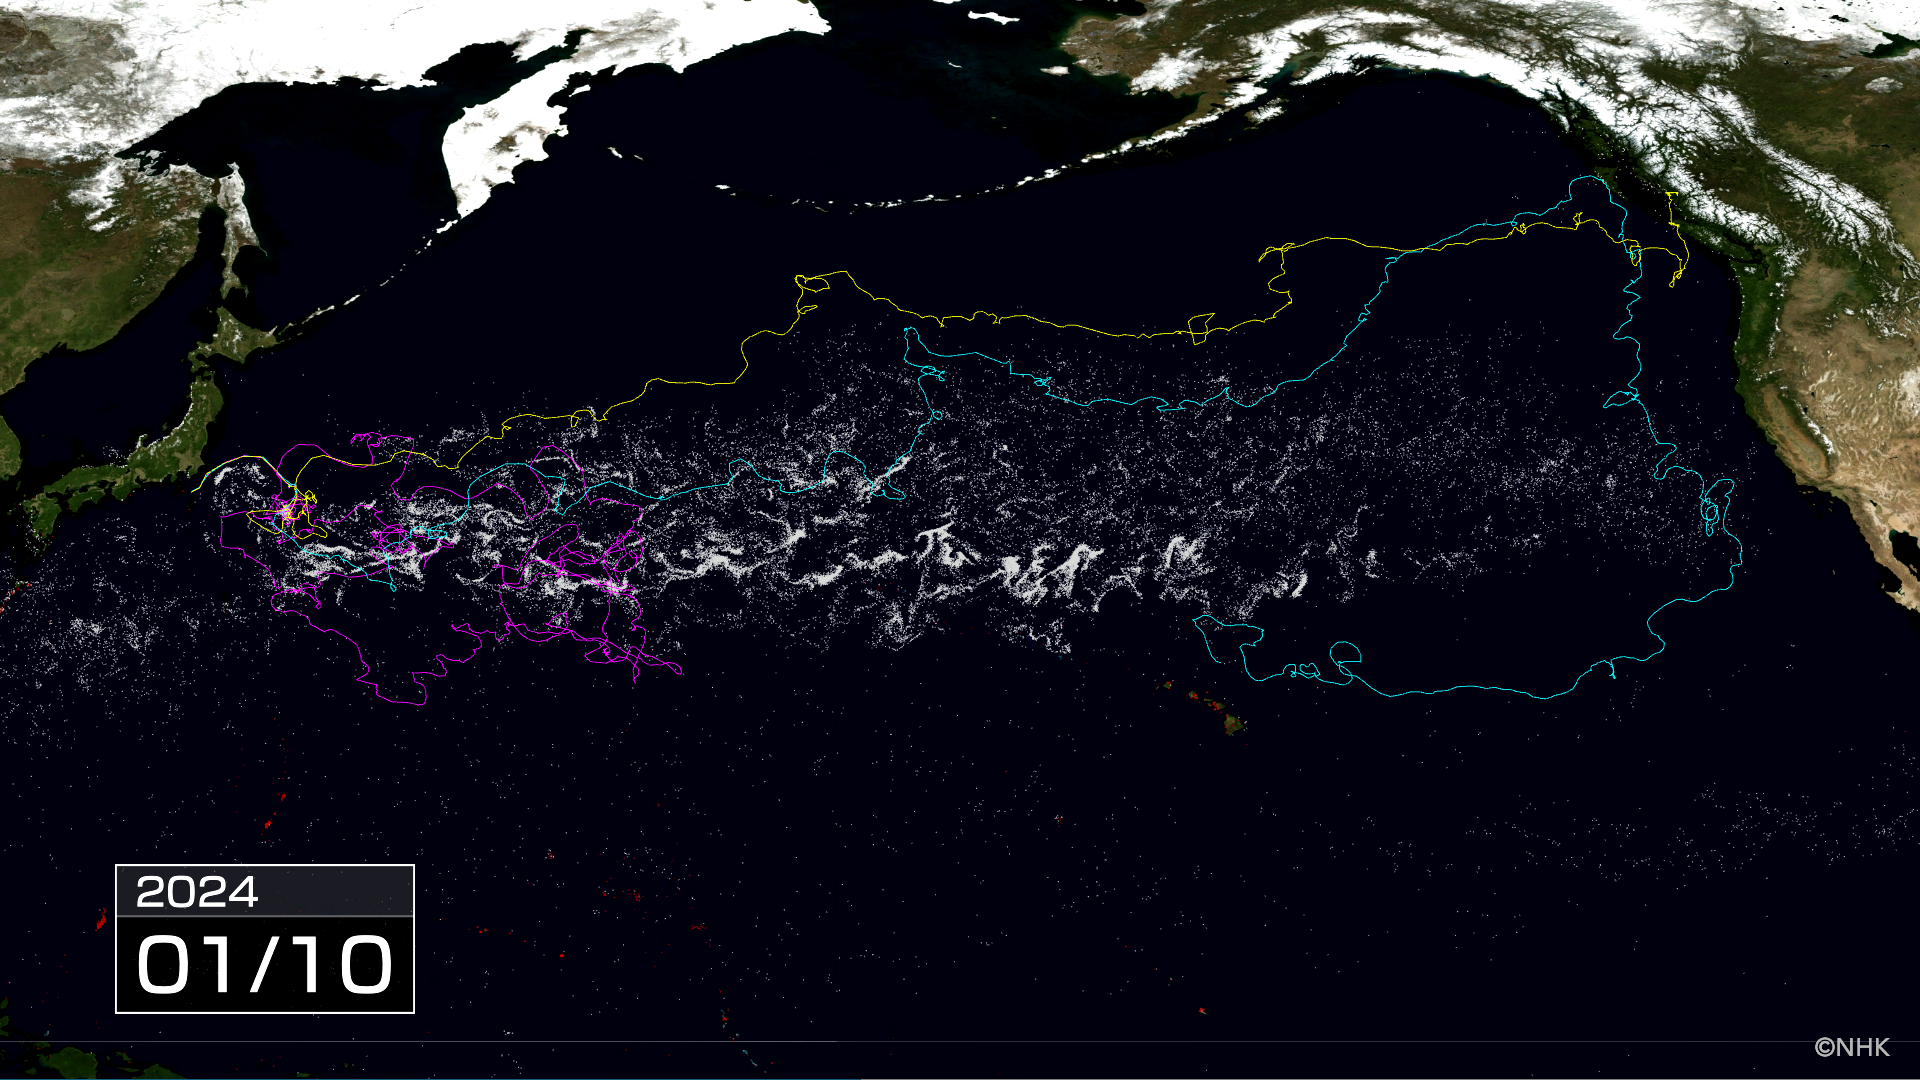
In this project, Professor Isobe and NHK collaborated to visualize the simulation data based on this model in 8K resolution for the first time.
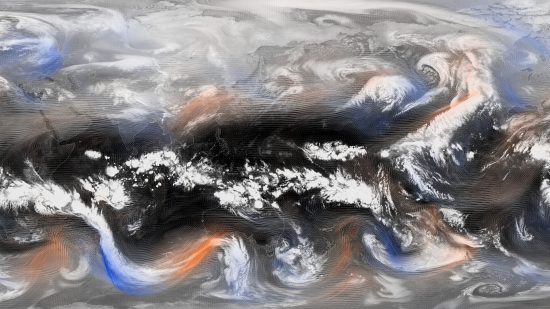
The visualization clearly shows how microplastics drift over a wide area from East Asia to the Pacific Ocean and indicates hot spots where suspended particles tend to gather. By following the trajectory of the particles, it is possible to understand how and where they travel.
Exhibition
- A special exhibition for learning about biodiversity at NHK PLUS CROSS SHIBUYA, Tokyo from Nov. 13 to Dec. 19, 2021
このプロジェクトでは、東アジアから太平洋に拡散するマイクロプラスチックの様子を可視化している。
5mm程度に細かく分割されたプラスチックはマイクロプラスチックと呼ばれ、廃棄されたプラスチック製品から生じる。
大量のマイクロプラスチックは海洋を漂った後、3年程度で沈み海の底にたまっていると考えられる。海洋生物がマイクロプラスチックを摂取することでストレスとなったり、吸着した汚染物質によって生態系に大きな影響を及ぼすことが大きな問題となっている。
九州大学応用力学研究所の磯辺篤彦教授らは、海洋で収集したサンプルの分析と数値シミュレーショを組み合わせ、マイクロプラスチックの浮遊量と漂流を予測するモデルを開発している。
このプロジェクトでは、磯辺教授とNHKが協力し、この予測モデルによるシミュレーションデータを初めて8Kの高解像度でビジュアライズした。
このビジュアライズでは、東アジアから太平洋に向けてマイクロプラスチックが広範囲に漂流する様子が克明に映し出され、浮遊物が集まりやすいホットスポットの存在も確認できる。また、粒子の軌跡を追う事でどのような経路でどこに運ばれるのかを理解することができる。
展示
Credit
©NHK
データ提供:磯辺篤彦(九州大学)
データビジュアライズデザイン:山辺真幸
Simulation data provided by Atsuhiko Isobe (Kyushu University, Japan)
Visualization design by Masaki Yamabe