My recent work titled “The Visualization of Covid-19 infections in Japan” will be screened at “MADD. screening 2021”
My recent work titled “The Visualization of Covid-19 infections in Japan” will be screened at “MADD. screening 2021”, which will be held as a special program of SIGGRAPH Asia 2021 on December 16 and 17, 2021.
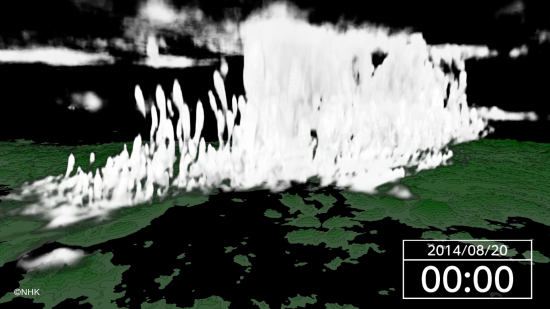
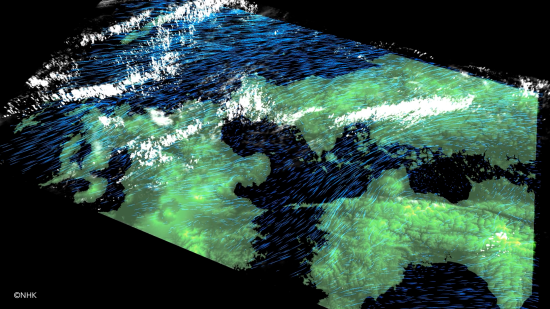
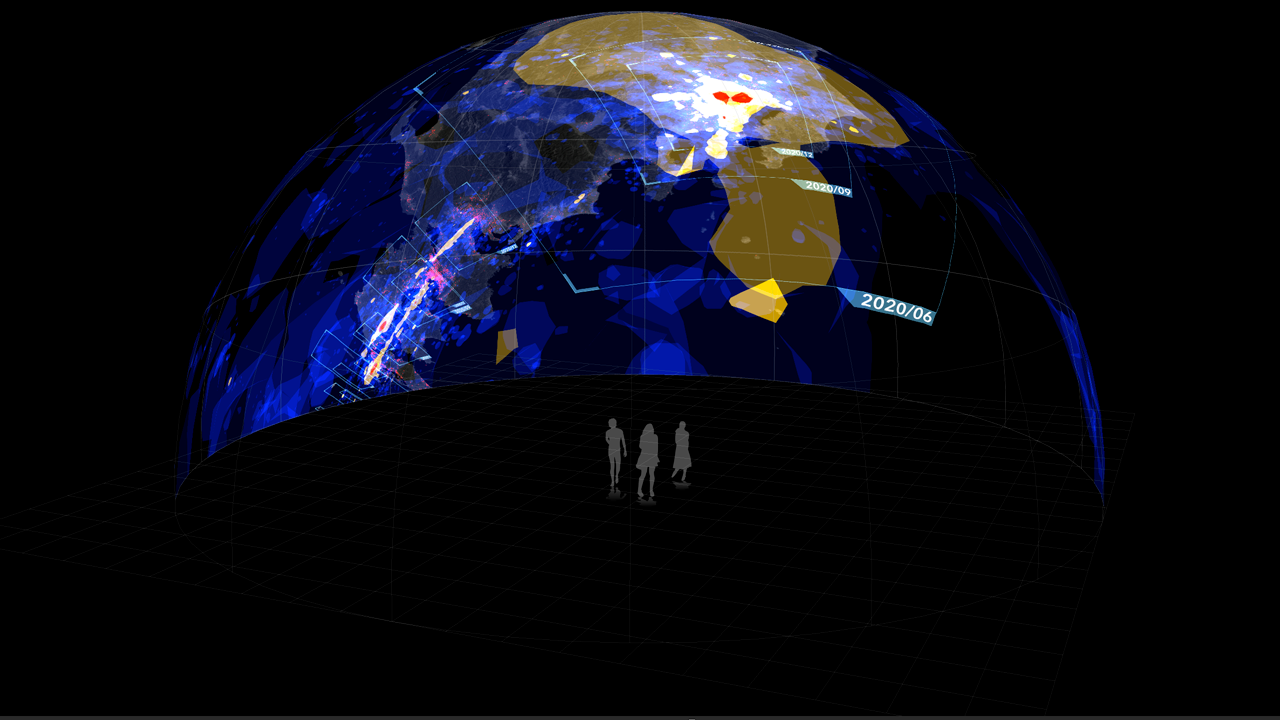
Based on the big data of new coronavirus infection reports recorded nationwide in 2020, this work visualizes the distribution and shift of infection risk in three dimensions. In this time, we express it in a 360-degree dome-shaped image. (The original visualization for flat-screen is here)
2021年12月16日、17日にSIGGRAPH Asia 2021のSpecial Programとして開催される「MADD. screening 2021」に「Visualization of Covid-19 infections in Japan」が上映されます。
本作品は2020年に全国で記録された新型コロナウイルス感染報告のビッグデータをもとに、感染リスクの分布と推移を立体的にビジュアル化し、360度のドーム型映像で表現したものです。(平面スクリーン用の作品はこちら)
Venue
Konica Minolta Planetaria TOKYO Dome1
Yurakucho Marion 9th Floor, 2-5-1 Yurakucho, Chiyoda-ku, Tokyo
https://planetarium.konicaminolta.jp/planetariatokyo/
Session
2021/12/16 (Thursday) 17 (Friday)
12: 00 ~ 18: 00
Admission
A SIGGRAPH Asia 2021 registrant pass is required
More info. and Timetable is on the organizer’s website.
会場
コニカミノルタプラネタリアTOKYO Dome1
東京都千代田区有楽町2丁目5-1 有楽町マリオン 9階
https://planetarium.konicaminolta.jp/planetariatokyo/
会期
2021/12/16(木)17(金)
12:00~18:00
入場
SIGGRAPH Asia 2021参加登録者パスをお持ちの方
タイムテーブルや詳しい情報はこちら
Credit:
Data visualization by Masaki Yamabe (Keio University)
Scientific advisor and technical support by Tomoki Nakaya (Tohoku University)
Scientific research support by NHK and NHK Educational Corp.
Data provided by JX PRESS Corp.
クレジット
データビジュアライズ:山辺真幸(慶應義塾大学大学院)
立体化監修:中谷友樹(東北大学大学院)
制作協力:NHK、株式会社NHKエデュケーショナル
データ協力:株式会社JX通信社